
In today’s data-driven world, organizations of all sizes are constantly seeking tools to make sense of their data and turn it into actionable insights. One such tool that has gained immense popularity is Microsoft Power BI. Whether you’re a seasoned data analyst or a business professional new to analytics, Power BI offers a versatile and user-friendly platform to transform raw data into meaningful visualizations. In this blog, we’ll explore what makes Power BI a powerhouse in business intelligence and how you can leverage it to drive success.
What is Power BI?
Power BI is a business analytics service developed by Microsoft. It allows users to connect to various data sources, transform raw data into interactive dashboards and reports, and share insights across their organization. Power BI stands out for its intuitive interface, robust features, and seamless integration with other Microsoft tools like Excel, Azure, and Teams.
Key Features of Power BI
- Data Connectivity
Power BI supports a wide range of data sources, including databases (SQL Server, Oracle, MySQL), cloud services (Azure, Google Analytics, Salesforce), and flat files (Excel, CSV). This flexibility ensures that you can integrate data from multiple platforms effortlessly. - Data Transformation
The Power Query editor in Power BI simplifies data cleaning and transformation. You can filter, merge, split, or reshape data using a point-and-click interface or advanced scripting with M code. - Interactive Visualizations
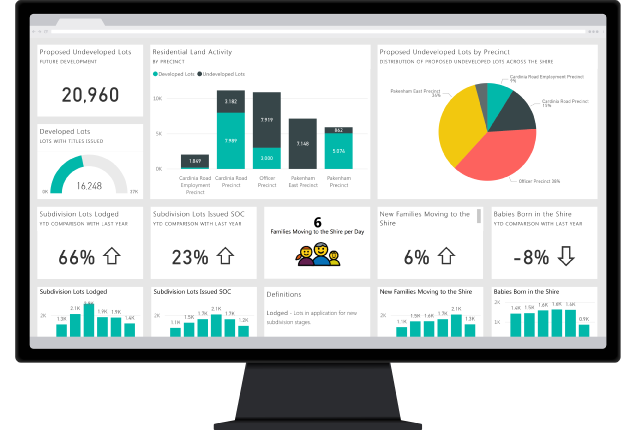
Power BI offers an extensive library of visuals, from bar charts and line graphs to heatmaps and scatter plots. You can also customize visuals or create your own using the Power BI Developer tools. - Real-Time Analytics
With real-time dashboards, Power BI enables businesses to monitor key metrics as they happen. This feature is particularly useful for operations like sales tracking or monitoring IoT devices. - AI-Powered Insights
Power BI leverages artificial intelligence for advanced analytics. Tools like Q&A allow users to query their data in natural language, while AI visuals like Key Influencers help uncover patterns and trends. - Seamless Sharing and Collaboration
Power BI makes it easy to share reports via the Power BI Service or embed them into apps and websites. Integration with Microsoft Teams further enhances collaboration.
Why Choose Power BI?
- User-Friendly Interface
Power BI’s drag-and-drop functionality and intuitive design make it accessible to users with varying levels of technical expertise. - Scalability
Whether you’re a freelancer analyzing small datasets or a large enterprise managing terabytes of data, Power BI scales to meet your needs. - Cost-Effectiveness
With options like Power BI Desktop (free) and affordable subscription plans for Power BI Pro and Premium, it’s a cost-effective solution for businesses of all sizes. - Robust Community and Support
Power BI boasts a vibrant community of users and developers, providing a wealth of tutorials, forums, and updates. Microsoft’s support ensures reliability and continuous improvement.
Getting Started with Power BI
- Download Power BI Desktop
Start by downloading the free Power BI Desktop application from Microsoft’s website. - Connect Your Data
Import data from your preferred sources and use the Power Query editor to clean and prepare your data. - Create Visualizations
Design your dashboards by dragging fields into the visualizations pane and customizing them to your needs.
Publish and Share
Once your report is ready, publish it to the Power BI Service for sharing and collaboration.
Use Cases of Power BI
- Sales Analysis: Monitor performance metrics, sales trends, and customer behavior in real-time.
- Marketing Campaigns: Track the ROI of campaigns and analyze audience engagement.
- Financial Reporting: Create detailed reports on revenue, expenses, and forecasts.
- Operations Management: Optimize inventory, logistics, and supply chain workflows.
- Healthcare Analytics: Analyze patient data for better outcomes and resource allocation.
Recent Updates and Announcements
As of January 2025, several significant updates and announcements have been made regarding Power BI:
- Pricing Changes: Microsoft has announced that starting April 1, 2025, Power BI Pro licenses will be priced at USD 14 per user per month, and Premium Per User (PPU) licenses will be USD 24 per user per month. This marks the first pricing update since Power BI’s launch nearly a decade ago.
- Power BI Premium Licensing Discontinuation: Existing customers without an Enterprise Agreement (EA) will be able to renew their Power BI Premium capacity until January 1, 2025. After this date, certain licensing options will be discontinued, and customers are advised to review the new licensing models and consider migration paths to ensure continued service.
- Upcoming Features: The Power BI team has indicated that all planned updates, including the next Power BI Desktop release, will roll out in January 2025. Users can anticipate new features and enhancements aimed at improving user experience and expanding analytical capabilities.
Training Opportunities: For those looking to enhance their Power BI skills, a virtual “Dashboard-in-a-Day” training session is scheduled for January 29, 2025. This free, online workshop will cover an introduction to the desktop tool, data transformation, data modeling, and visualization techniques.
Conclusion
Power BI empowers businesses to harness the true potential of their data. With its intuitive design, powerful analytics capabilities, and seamless integration, it’s no wonder that Power BI has become a go-to tool for business intelligence. Whether you’re looking to drive strategic decisions or simply make sense of your data, Power BI is a game-changer.
Want to read more interesting blogs like this……Visit https://www.codersbrain.com/blog/
For Career Opportunities visit : https://www.codersbrain.com/careers/.